COVID-19 Data Dashboard
The official advanced traveler information system for the State of New Mexico.
Challenge
The New Mexico Department of Health needed a public reporting tool for COVID-19 cases, tests, and hospitalizations.
Solution
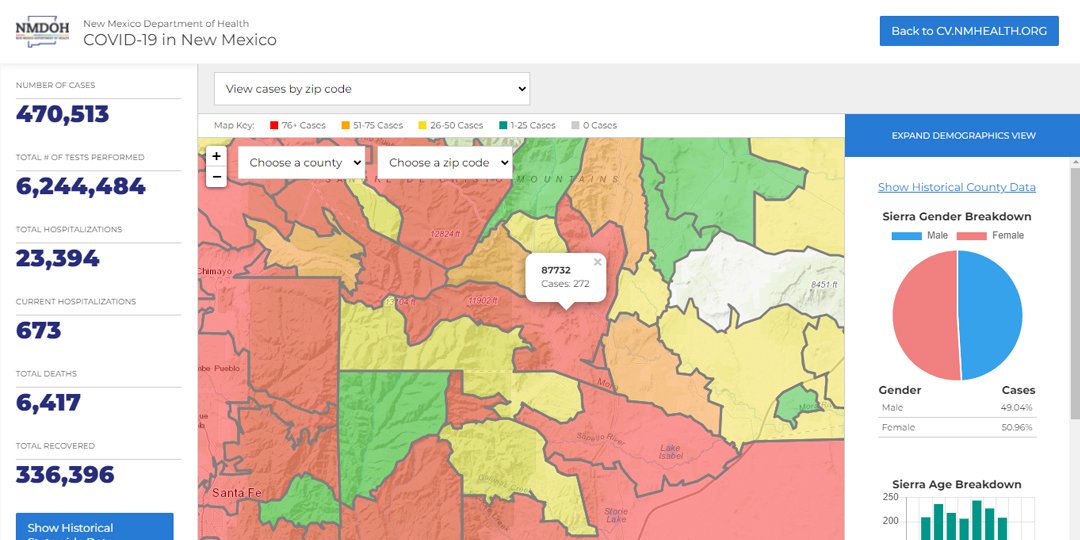
A web-based reporting dashboard was developed to address the need. The system is a GIS based application that allows the users to see real time data down to the zip code level.
Results
The reporting tool has been extremely helpful for communities to see the rapid spread of the virus within their communities.
COVID hit the world hard and fast. Governments were scrambling to address the crisis and the general population was fearful of the unknown. Data and reporting are extermely important to keep communities safe and informed. The epidemiologists at New Mexico Department of Health use this system to update the public on COVID case rates, performed tests, and hospitalization statewide. Below are a few of the features of the system.
Easy to Update Data Hub
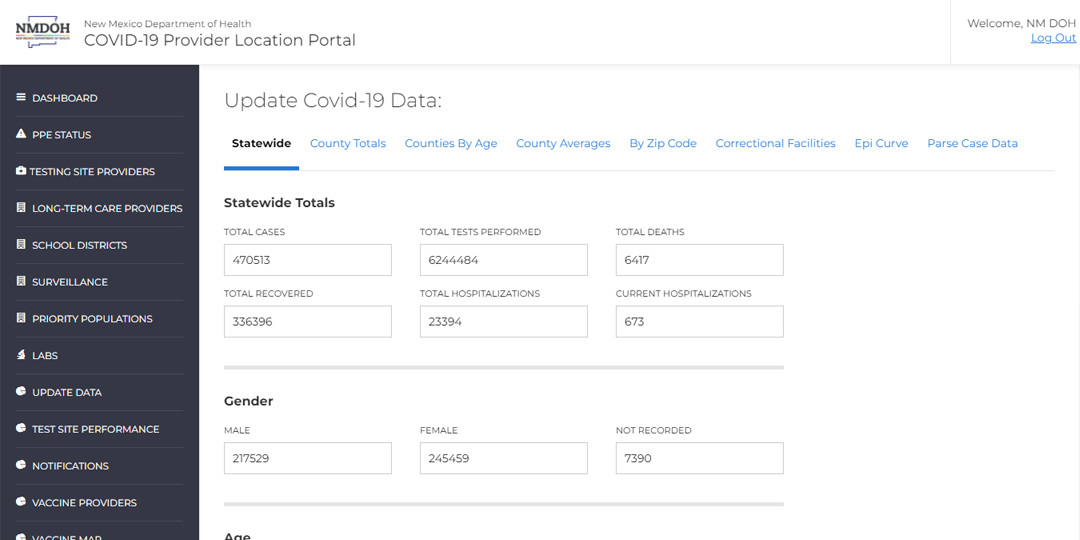
The epidemiologists at the New Mexico Department of Health update the data source that feed the COVID-19 Data Dashboard daily. They break the data down by state, county, and zip. The department also reports on demographic data such as age, race/ethnicity, and gender.
Granular Reporting
The public can explore the COVID-19 Data Dashboard in their community and others. Based on the data uploads from the New Mexico Department of Health community members can visualize where the virus is spreading within their communities.
Historical Data
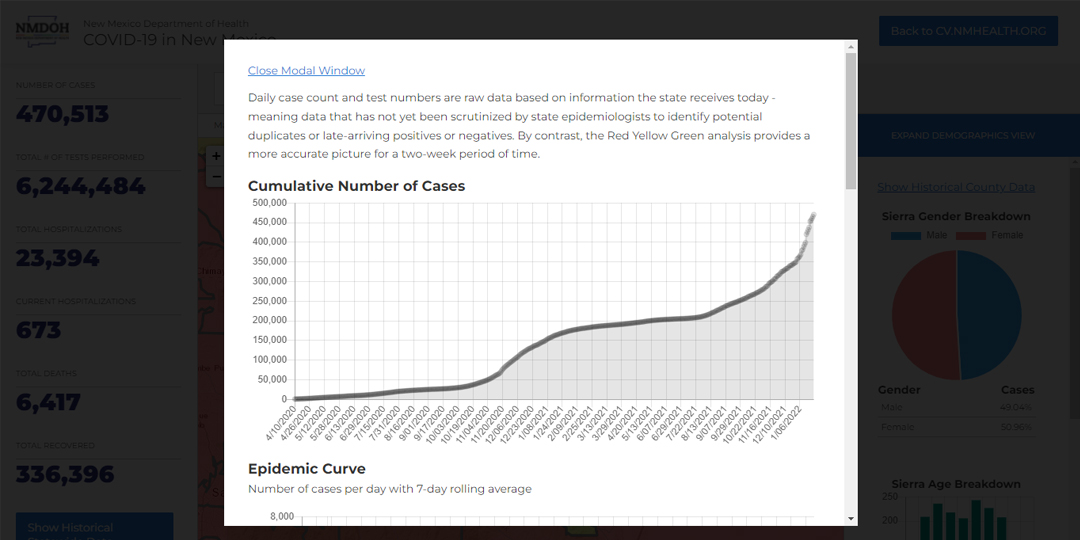
The COVID-19 Data Dashboard stores the data for a historical look at the virus has impacted the state. This historical view can be seen at the state and county level and includes data related to cases, positivity rates, and deaths.
Data Visualizations
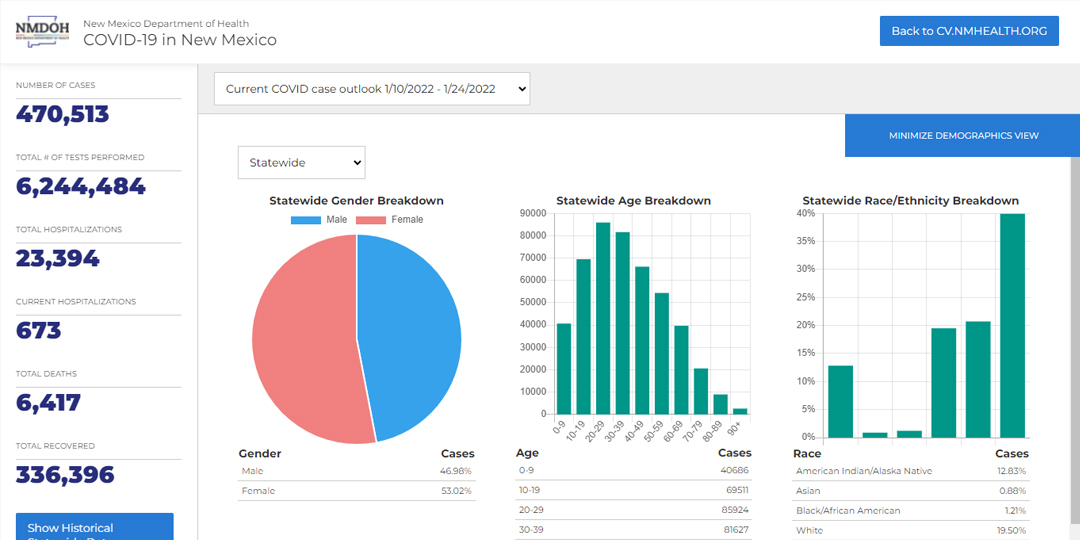
The COVID-19 Data Dashboard presents the data based on demographics as well. The public can explore data based on gender, age, and race/ethnicity.


